Status App monitors external applications and displays live status and historical uptime stats.

Monitors
First you need to describe which APP and URL should be monitored: these is what monitors are.
. Go to the Data Management Web item
. Choose Other, Status, New
. Add APP name, URL, expected pattern, expected status code (e.g. 200)
When you save the monitor object, monitoring starts immediately.
You can also add a monitor with a YAML imported configuration (CLI, UI, API) :
- classname: status_monitor
  keyname: apache
  displayname: www.apache.org
  app: apache
  type: HTTP
  target: https://www.apache.org/
  http_code: 200
  pattern: About
  timeout: 2000
  schedule: 10
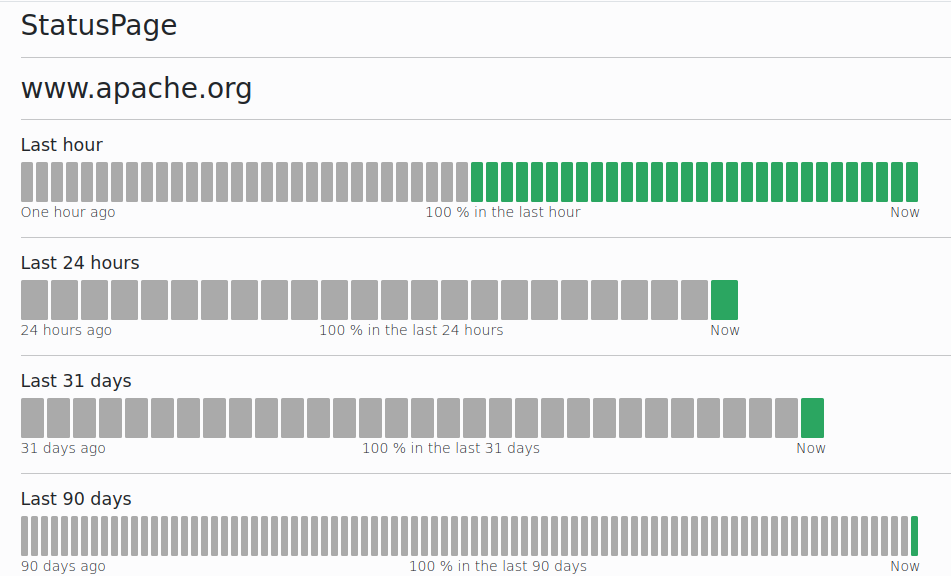
Status Monitor Page
Now, go to the Status Monitor Service from the sidebar.
You should see all active monitors, with uptime (live), and availability ratio for last hour, last day, last month, last 90 days, and last year.
To access details for a specific monitor, clic on it’s name.
You should see a green/orange/red bargraph for the various time range.
Internals
Internally, Status Monitor service is based on the followings:
- a Schema structure to manage Monitor (name, URLs, expected results)
- a Raw an Sampled DB Table to store
- a periodic task to run monitor checks
- a periodic task to sample raw data and perform automatic cleanup
Status Monitor is suitable to monitor a small number of external services, directly from the Cavaliba server.
At a later time, an external agent may be provided :
- to support many more concurrent monitors with high volume / parall checks
- distribute check source accross networks to increase statistic quality
- support different checks (TCP sockets, query/response, etc.)